


Exness is an overseas forex broker chosen by traders worldwide for its industry-leading low spreads and high leverage .
but"Is the spread really that narrow?" "Which stocks offer the best odds?"Many people have this question
Especially with popular assets such as currency pairs, gold, stock indices, and cryptocurrencies, even a small difference in transaction costs can significantly impact short-term trading profits
In this article, the MoneyChat editorial team independently measured Exness's spreads and compiled a detailed summary of the actual trading costs
Contents
- 1 Basic knowledge about Exness spreads
- 2 Exness Currency Pair Spread List
- 3 Exness Precious Metals CFD Spread List
- 4 Exness Energy CFD Spread List
- 5 Exness Stock Index CFD Spread List
- 6 Exness Cryptocurrency CFD Spread List
- 7 Exness Stock CFD Spread List
- 8 Comparing Exness's standard stock spreads with those of other companies
- 9 Points to note and summary regarding Exness spreads
- 10 Frequently Asked Questions about Exness Spreads
- 11 To reduce Exness costs, try "MoneyChat's Cashback."
Basic knowledge about Exness spreads
Here, we will explain the following two points as basic knowledge about Exness spreads
- Exness's spreads are either variable or fixed in principle
- The concept of effective cost, which includes both the spread and fees
The spread is a significant trading cost in FX and CFD trading
Let's take a look at the basic specifications regarding Exness's spreads and see how much each trade will cost
Exness's spreads are either variable or fixed in principle
At Exness, the spread structure differs depending on the account type
Standard accounts, Standard Cent accounts, Pro accounts, and Low Spread accounts all use a variable spread system, meaning the spread fluctuates depending on market liquidity and time of day
On the other hand, Zero Accounts are characterized by their fixed interest rate.
With major instruments maintaining zero spreads for over 95% of the time, this platform is suitable for those seeking a stable trading environment
The concept of effective cost, which includes both the spread and fees
It's important to understand not only the spread itself, but also the actual cost including fees
With Exness, some accounts, like the Standard account, have no commissions but slightly wider spreads, while others, like the Zero account and Low Spread account, have extremely narrow spreads plus a commission per trade.
For example, if you trade EUR/USD with a spread of 0 plus a round-trip commission of $7, the actual cost will be around $0.7
By being mindful of these combined factors, it becomes easier to determine which account type best suits your trading style
Exness Currency Pair Spread List
Here, we will explain the spreads for currency pairs handled by Exness in the following order
- Exness's list of spreads for major currency pairs
- Exness's list of spreads for cross currency pairs and minor currency pairs
- Exnessn's list of spreads for exotic currency pairs
For each currency pair, the spread is measured during the trading hours of the three major markets: Tokyo, London, and New York, and the actual average spread including trading fees is listed
Exness's list of spreads for major currency pairs
The effective and average spreads for major currency pairs on Exness are as follows:
Exness's list of spreads for major currency pairs
| currency pair | Standard account (pips) | Standard cent account (pips) | Pro account (pips) | Low spread account (pips) | Zero account (pips) |
|---|---|---|---|---|---|
| EUR/USD ( Euro / US Dollar) | 0.9 | 0.9 | 0.6 | 0.95 (0.6+0.35) | 0.35 (0.0+0.35) |
| GBP/USD (British Pound/US Dollar) | 1 | 1.1 | 0.7 | 1.05 (0.7+0.35) | 0.45 (0.0+0.45) |
| USD/JPY (US Dollar / Japanese Yen) | 1 | 0.9 | 0.7 | 1.05 (0.7+0.35) | 0.35 (0.0+0.35) |
| USDCHF ( US Dollar / Swiss Franc) | 1.3 | 1.2 | 0.9 | 1.25 (0.9+0.35) | 0.55 (0.1+0.45) |
| USDCAD (US Dollar / Canadian Dollar) | 1.5 | 1.5 | 1.1 | 1.45 (1.1+0.35) | 0.40 (0.0+0.40) |
| AUD/USD (Australian Dollar / US Dollar) | 0.9 | 0.9 | 0.6 | 0.95 (0.6+0.35) | 0.35 (0.0+0.35) |
| NZDUSD ( New Zealand Dollar / US Dollar) | 1.8 | 1.8 | 1.3 | 1.65 (1.3+0.35) | 0.65 (0.0+0.65) |
Exness offers consistently narrow spreads on major currency pairs such as EURUSD and USDJPY, often hovering around 0.3 to 0.5 pips during periods of high liquidity within the day.
The more trading volume a major currency pair has, the easier it is to keep costs down, and a common advantage is that the cost burden is low not only for short-term trading but also for long-term holding
EURUSD, in particular, tends to trade at the narrowest spreads, and according to the spread measurements conducted by the MoneyChat editorial team, the Zero account offered an astonishingly low spread of effectively averaging 0.35 pips, even including trading fees
Exness's list of spreads for cross currency pairs and minor currency pairs
The effective and average spreads for Exness's cross currency pairs and minor currency pairs are as follows:
Exness's list of spreads for cross currency pairs and minor currency pairs
| currency pair | Standard account (pips) | Standard cent account (pips) | Pro account (pips) | Low spread account (pips) | |
|---|---|---|---|---|---|
| AUDCAD ( Australian Dollar / Canadian Dollar) | 2.2 | 2.2 | 1.4 | 1.95 (1.6+0.35) | 0.65 (0.2+0.45) |
| AUDCHF Australian Dollar / Swiss Franc | 1.1 | 1.1 | 1.6 | 1.05 (0.7+0.35) | 0.55 (0.1+0.45) |
| AUD/JPY ( Australian Dollar / Japanese Yen) | 1.9 | 1.9 | 0.7 | 1.65 (1.3+0.35) | 0.45 (0.0+0.45) |
| AUDNZD Australian Dollar / New Zealand Dollar | 2 | 2 | 1.3 | 0.55 (0.2+0.35) | 0.40 (0.0+0.40) |
| CADCHF Canadian Dollar / Swiss Franc | 0.9 | 0.7 | 1.05 (0.7+0.35) | 0.45 (0.0+0.45) | |
| CAD/JPY Canadian Dollar / Japanese Yen | 3.8 | 3.8 | 2.6 | 2.95 (2.6+0.35) | 1.20 (0.7+0.50) |
| CHFJPY Swiss Franc / Japanese Yen | 2.8 | 2.8 | 2 | 2.35 (2.0+0.35) | 0.70 (0.2+0.50) |
| EURAUD ( Euro / Australian Dollar) | 3.4 | 3.4 | 1 | 3.15 (2.8+0.35) | 0.90 (0.0+0.90) |
| EURCAD ( Euro / Canadian Dollar) | 2.9 | 2.9 | 2.4 | 2.35 (2.0+0.35) | 0.85 (0.3+0.55) |
| EURCHF Euro / Swiss Franc | 2.4 | 2.4 | 1.8 | 2.15 (1.8+0.35) | 0.75 (0.2+0.55) |
| EURGBP Euro / British Pound | 1.4 | 1.4 | 1.7 | 1.35 (1.0+0.35) | 1.00 (0.4+0.60) |
| EUR/JPY ( Euro / Japanese Yen) | 2.4 | 2.4 | 3.7 | 2.05 (1.7+0.35) | 0.50 (0.0+0.50) |
| EURNZD Euro / New Zealand Dollar | 5.4 | 5.4 | 2 | 2.15 (1.8+0.35) | 1.80 (1.3+0.50) |
| GBPAUD (British Pound / Australian Dollar) | 2.5 | 2.5 | 1.7 | 2.05 (1.7+0.35) | 0.65 (0.0+0.65) |
| GBPCAD (British Pound / Canadian Dollar) | 4.8 | 4.8 | 1.6 | 3.75 (3.4+0.35) | 1.20 (0.4+0.80) |
| GBPCHF (British Pound / Swiss Franc) | 2.4 | 2.4 | 1.7 | 2.05 (1.7+0.35) | 0.85 (0.0+0.85) |
| GBP/JPY (British Pound / Japanese Yen) | 2.2 | 2.2 | 3.4 | 1.95 (1.6+0.35) | 0.75 (0.0+0.75) |
| GBPNZD ( British Pound / New Zealand Dollar) | 5.8 | 5.8 | 4.1 | 2.45 (2.1+0.35) | 1.35 (0.6+0.75) |
| HKDJPY Hong Kong Dollar / Japanese Yen | 2.9 | – | 2 | 1.05 (0.7+0.35) | 0.95 (0.6+0.35) |
| HUFJPY Hungarian Forint / Japanese Yen | 5.4 | – | 3.8 | 5.75 (5.4+0.35) | 11.45 (11.1+0.35) |
| MXNJPY Mexican Peso / Japanese Yen | 39.2 | – | 27.4 | 11.35 (11.0+0.35) | 11.45 (11.1+0.35) |
| NOKJPY Norwegian Krone / Japanese Yen | 19.3 | – | 13.5 | 10.85 (10.5+0.35) | 0.95 (0.6+0.35) |
| NZDCAD ( New Zealand Dollar / Canadian Dollar) | 2.5 | – | 1.4 | 0.95 (0.6+0.35) | 0.75 (0.3+0.45) |
| NZDCHF ( New Zealand Dollar / Swiss Franc) | 1.5 | – | 1 | 0.80 (0.45+0.35) | 0.81 (0.5+0.3125) |
| NZDJPY New Zealand Dollar / Japanese Yen | 4.3 | 4.3 | 3 | 1.75 (1.4+0.35) | 1.05 (0.3+0.75) |
| PLNJPY Polish Zloty / Japanese Yen | 417.2 | – | 288.9 | 289.25 (288.9+0.35) | |
| SEKJPY Swedish Krona / Japanese Yen | 26.4 | – | 18.5 | 14.85 (14.5+0.35) | 3.25 (2.9+0.35) |
| SGDJPY Singapore Dollar / Japanese Yen | 6.3 | – | 4.5 | 2.75 (2.4+0.35) | 2.55 (2.2+0.35) |
| TRY/JPY Turkish Lira / Japanese Yen | 2.9 | – | 2.2 | 1.05 (0.7+0.35) | 0.75 (0.4+0.35) |
| ZARJPY South African Rand / Japanese Yen | 3 | – | 2.1 | 0.80 (0.8+0.0) | 3.85 (0.0+3.5) |
Cross currency pairs and minor currency pairs generally have slightly wider spreads compared to major currency pairs
While minor currency pairs with limited liquidity, such as AUDCAD and AUDNZD, they can settle around 1 pip.
For traders with high trading frequency, costs tend to increase, so it's recommended to be mindful of volatility and trading hours, or to specialize in medium- to long-term trades where the impact of spreads is minimal
Exness's list of spreads for exotic currency pairs
The effective and average spreads for Exness's exotic currency pairs are as follows:
Exness's list of spreads for exotic currency pairs
| currency pair | Standard account (pips) | Standard cent account (pips) | Pro account (pips) | Low spread account (pips) | Zero account (pips) |
|---|---|---|---|---|---|
| AUDCZK Australian Dollar / Czech Koruna | 23.2 | – | 16.1 | – | – |
| AUDDKK Australian Dollar / Danish Krone | 571.8 | – | 400.2 | – | 252.45 (252.1+0.35) |
| AUDHUF ( Australian Dollar / Hungarian Forint) | 29.3 | – | 20.6 | – | – |
| AUDMXN Australian Dollar / Mexican Peso | 95.1 | – | 66.2 | – | 0.35 (0.0+0.35) |
| AUD /Norwegian Krone | 520.2 | – | 364.2 | – | 254.15 (253.8+0.35) |
| AUDPLN ( Australian Dollar) / Polish Zloty | 245.5 | – | 170.1 | – | – |
| AUDSEK ( Australian Dollar) / Swedish Krona | 610.7 | – | 428.7 | – | 66.05 (65.7+0.35) |
| AUDSGD ( Australian Dollar / Singapore Dollar) | 4.8 | – | 3.4 | – | 3.05 (2.7+0.35) |
| AUD TRY ( Australian Dollar) / TRY (Turkish Lira) | 1567.9 | – | 1091.5 | – | 517.75 (517.4+0.35) |
| AUDZAR ( Australian Dollar) / South African Rand | 326.2 | – | 196.6 | – | 0.35 (0.0+0.35) |
| CADCZK Canadian Dollar / Czech Koruna | 25.3 | – | 17.7 | – | – |
| CADMXN Canadian Dollar / Mexican Peso | 1334 | – | 933.8 | – | – |
| CADNOK ( Canadian Dollar) / Norwegian Krone | 970.7 | – | 679.5 | – | – |
| CADPLN Canadian Dollar / Polish Zloty | 273.4 | – | 189.5 | – | – |
| CADTRY ( Canadian Dollar) / Turkish Lira | 1742.1 | – | 1212.9 | – | 632.05 (631.7+0.35) |
| CHFDKK Swiss Franc / Danish Krone | 119.9 | – | 83.8 | – | 15.05 (14.7+0.35) |
| CHFHUF Swiss Franc / Hungarian Forint | 57.3 | – | 40.2 | – | – |
| CHFMXN Swiss Franc / Mexican Peso | 187.4 | – | 130.8 | – | – |
| CHFNOK Swiss Franc / Norwegian Krone | 1676.5 | – | 1173.5 | – | 807.95 (807.6+0.35) |
| CHFPLN Swiss Franc / Polish Zloty | 473 | – | 327.8 | – | |
| CHFSEK Swiss Franc / Swedish Krona | 2020.7 | – | 1414.4 | – | 996.25 (995.9+0.35) |
| CHFSGD Swiss Franc / Singapore Dollar | 23.5 | – | 16.6 | – | 12.15 (11.8+0.35) |
| CHFTRY Swiss Franc / Turkish Lira | 3025.5 | – | 2106.3 | – | 1140.85 (1140.5+0.35) |
| CHFZAR Swiss Franc / South African Rand | 506.2 | – | 232.3 | – | 95.35 (95.0+0.35) |
| CZKPLN Czech Koruna / Polish Zloty | 20.4 | – | 14.2 | – | – |
| DKKCZK Danish Krone / Czech Koruna | 9.4 | – | 6.5 | – | – |
| DKKHUF Danish Krone / Hungarian Forint | 13.1 | – | 9.1 | – | – |
| DKKPLN Danish Krone / Polish Zloty | 65.8 | – | 45.6 | – | – |
| DKKSGD Danish Krone / Singapore Dollar | 5.2 | – | 3.6 | – | 3.65 (3.3+0.35) |
| DKKZAR Danish Krone / South African Rand | 83.6 | – | 43 | – | – |
| EURCZK Euro / Czech Koruna | 39.8 | – | 27.6 | – | – |
| EURDKK Euro / Danish Krone | 60.9 | – | 42.6 | – | – |
| EURHKD Euro / Hong Kong Dollar | 44.9 | – | 31.4 | – | – |
| EURHUF Euro / Hungarian Forint | 46.7 | – | 30.5 | – | – |
| EURMXN Euro / Mexican Peso | 154.1 | – | 106.8 | – | 38.15 (37.8+0.35) |
| EURNOK ( Euro) / Norwegian Krone | 700 | – | 493.1 | – | 328.95 (328.6+0.35) |
| EURPLN Euro / Polish Zloty | 160.8 | – | 112.6 | – | 49.35 (49.0+0.35) |
| EURSEK ( Euro) / Swedish Krona | 837.6 | – | 580.6 | – | 400.95 (400.6+0.35) |
| EURSGD Euro / Singapore Dollar | 8.6 | – | 6 | – | 2.95 (2.6+0.35) |
| EURTRY ( Euro) / Turkish Lira | 1517 | – | 1263.2 | – | 880.05 (879.7+0.35) |
| EURZAR ( Euro) / South African Rand | 866.6 | – | 606.6 | – | 298.25 (297.9+0.35) |
| GBPCZK British Pound / Czech Koruna | 46.1 | – | 32.1 | – | – |
| GBPDKK ( British Pound / Danish Krone) | 666.6 | – | 466.7 | – | 275.75 (275.4+0.35) |
| GBPHUF ( British Pound / Hungarian Forint) | 57.5 | – | 40.3 | – | – |
| GBPILS ( British Pounds / Israeli Shekels) | 61.6 | – | 43 | – | – |
| GBPMXN British Pound / Mexican Peso | 178 | – | 123.8 | – | – |
| GBPNOK ( British Pound / Norwegian Krone) | 1805.9 | – | 1264 | – | – |
| GBPPLN (British Pound / Polish Zloty) | 508.3 | – | 352.4 | – | – |
| GBPSEK (British Pound / Swedish Krona) | 2180.2 | – | 1526 | – | 126.75 (126.4+0.35) |
| GBPSGD ( British Pound / Singapore Dollar) | 207 | – | 144.9 | – | 93.45 (93.1+0.35) |
| GBPTRY ( British Pound / Turkish Lira) | 3228.9 | – | 2247.7 | – | 1199.45 (1199.1+0.35) |
| GBPZAR ( British Pound / South African Rand) | 591.3 | – | 344.6 | – | 88.95 (88.6+0.35) |
| NOKDKK Norwegian Krone / Danish Krone | 91 | – | 63.7 | – | 51.65 (51.3+0.35) |
| NOKSEK Norwegian Krone / Swedish Krona | 282.5 | – | 197.7 | – | – |
| NZDCZK New Zealand Dollar / Czech Koruna | 23.6 | – | 16.4 | – | – |
| NZDDKK ( New Zealand Dollar) / Danish Krone | 184.8 | – | 129.3 | – | – |
| NZDHUF New Zealand Dollar / Hungarian Forint | 30.7 | – | 21.6 | – | – |
| NZDMXN New Zealand Dollar / Mexican Peso | 109.4 | – | 76.2 | – | 39.25 (38.9+0.35) |
| NZDNOK ( New Zealand Dollar) / Norwegian Krone | 800.2 | – | 560.1 | – | – |
| NZDPLN New Zealand Dollar / Polish Zloty | 226.7 | – | 157.2 | – | – |
| NZDSEK New Zealand Dollar / Swedish Krona | 961.5 | – | 673 | – | 466.65 (466.3+0.35) |
| NZDSGD New Zealand Dollar / Singapore Dollar | 12.5 | – | 8.8 | – | 3.05 (2.7+0.35) |
| NZDTRY ( New Zealand Dollar) / Turkish Lira | 1469.9 | – | 1023.5 | – | – |
| NZDZAR ( New Zealand Dollar / South African Rand) | 570.2 | – | 399.2 | – | 192.55 (192.2+0.35) |
| PLNDKK Polish Zloty / Danish Krone | 202 | – | 140.1 | – | – |
| PLNHUF Polish Zloty / Hungarian Forint | 1064.3 | – | 736.7 | – | – |
| PLNSEK Polish Zloty / Swedish Krona | 708.3 | – | 493.9 | – | – |
| SEKDKK ( Swedish Krone / Danish Krone) | 120.8 | – | 84.5 | – | – |
| SEKPLN Swedish Krona / Polish Zloty | 103 | – | 71.8 | – | – |
| SGDHKD Singapore Dollar / Hong Kong Dollar | 116.6 | – | 82.2 | – | – |
| TRYDKK ( Turkish Lira / Danish Krone) | 1.1 | – | 0.8 | – | – |
| TRYZAR Turkish Lira / South African Rand | 262.2 | – | 183.5 | – | – |
| USDAED (US Dollar) / UAE Dirham | 16.5 | – | 11.5 | 11.85 (11.5+0.35) | – |
| USDAMD ( US Dollar / Armenian Drum) | 1475.6 | – | 1032.9 | 738.15 (737.8+0.35) | – |
| USDARS ( US Dollar / Argentine Peso) | 33852.1 | – | 23696.5 | 16926.45 (16926.1+0.35) | – |
| USDAZN US Dollar / Azerbaijani Manat | 15.2 | – | 10.6 | 7.95 (7.6+0.35) | – |
| USDBDT ( US Dollar / Bangladeshi Taka) | 3170 | – | 2219 | 1585.35 (1585.0+0.35) | – |
| USDBGN ( US Dollar / Bulgarian Lev) | 11.8 | – | 8.3 | 6.25 (5.9+0.35) | – |
| USDBHD ( US Dollar / Bahraini Dinar) | 24.9 | – | 17.5 | 12.85 (12.5+0.35) | – |
| USDBND (US Dollar / Brunei Dollar) | 0.9 | – | 0.6 | 0.85 (0.5+0.35) | – |
| USDBRL ( US Dollar / Brazilian Real) | 4.6 | – | 3.2 | 2.55 (2.2+0.35) | – |
| USDCLP ( US Dollar / Chilean Peso) | 2319.6 | – | 1617.5 | 1150.35 (1150.0+0.35) | – |
| USDCNH US Dollar / Offshore Chinese Yuan | 39.1 | – | 26.8 | 16.05 (15.7+0.35) | – |
| USD/CNY US Dollar / Chinese Yuan | 39.7 | – | 27.8 | 20.15 (19.8+0.35) | – |
| USDCOP ( US Dollar / Colombian Peso) | 3710.2 | – | 2590.9 | 1851.05 (1850.7+0.35) | – |
| USDCZK ( US Dollar / Czech Koruna) | 24.7 | – | 17.2 | 12.3 (12.3+0.0) | – |
| USDDKK ( US Dollar / Danish Krone) | 64.7 | – | 45.2 | 30.9 (30.9+0.0) | – |
| USD/ZD US Dollar / Algerian Dinar | 5846.6 | – | 4087.5 | 2919.95 (2919.6+0.35) | – |
| USD/EGP ( US Dollar / Egyptian Pound) | 1065.9 | – | 746 | 533.25 (532.9+0.35) | – |
| USDGEL ( US Dollar / Georgian Lari) | 28.8 | – | 20.2 | 14.75 (14.4+0.35) | – |
| USDGHS US Dollar / Ghanaian Cedi | 5064.5 | – | 3537.4 | 2527.05 (2526.7+0.35) | – |
| USD/HKD US Dollar / Hong Kong Dollar | 39.1 | 39.2 | 27.4 | 15.95 (15.6+0.35) | – |
| USDHRK ( US Dollar / Croatian Kuna) | 469.4 | – | 293.4 | 234.8 (234.8+0.0) | – |
| USDHUF ( US Dollar / Hungarian Forint) | 30.1 | – | 21.3 | 15.45 (15.1+0.35) | – |
| USDIDR ( US Dollar / Indonesian Rupiah) | 70000 | – | 49000 | 35000.35 (35000.0+0.35) | – |
| USDILS ( US Dollar / Israeli Shekel) | 32.6 | – | 22.7 | 18.3 (18.3+0.0) | – |
| USDINR ( US Dollar / Indian Rupee) | 194.5 | – | 136.1 | 97.65 (97.3+0.35) | – |
| USDISK ( US Dollar) / Icelandic Krona | 257.2 | – | 179.4 | 128.35 (128.0+0.35) | – |
| USDJOD US Dollar / Jordanian Dinar | 1.2 | – | 0.8 | 0.95 (0.6+0.35) | – |
| USDKES US Dollar / Kenyan Shilling | 36168.5 | – | 25332.5 | 18095.05 (18094.7+0.35) | – |
| USDKGS US Dollar / Kyrgyz Som | 48.8 | – | 34.2 | 24.75 (24.4+0.35) | – |
| USDKRW ( US Dollar / South Korean Won) | 1711.4 | – | 1199.1 | 857.55 (857.2+0.35) | – |
| USDKWD US Dollar / Kuwaiti Dinar | 0.8 | – | 0.6 | 0.75 (0.4+0.35) | – |
| USDKZT US Dollar / Kazakhstan Tenge | 15.1 | – | 10.5 | 7.85 (7.5+0.35) | – |
| USDLBP ( US Dollar / Lebanese Pound) | 2490556.2 | – | 1743389.4 | 1245278.55 (1245278.2+0.35) | – |
| USDLKR ( US Dollar / Sri Lankan Rupee) | 9103.2 | – | 6372.3 | 4550.05 (4549.7+0.35) | – |
| USDMAD ( US Dollar) / Moroccan Dirham | 600 | – | 420 | 300.35 (300.0+0.35) | – |
| USDMXN ( US Dollar / Mexican Peso) | 87.3 | – | 60.6 | 41.6 (41.6+0.0) | – |
| USD/MYR (US Dollar / Malaysian Ringgit) | 4.2 | – | 2.9 | 2.45 (2.1+0.35) | – |
| USDNGN ( US Dollar / Naira) | 16824.5 | – | 11777.2 | 8412.55 (8412.2+0.35) | – |
| USDNOK ( US Dollar / Norwegian Krone) | 1028 | – | 719.6 | 511.9 (511.9+0.0) | – |
| USD/NPR ( US Dollar / Nepalese Rupee) | 17791.2 | – | 12453.8 | 8895.95 (8895.6+0.35) | – |
| US Dollar / Omani Rial | 6.4 | – | 4.6 | 3.55 (3.2+0.35) | – |
| USD/PHP ( US Dollar / Philippine Peso) | 56.1 | – | 39.2 | 28.25 (27.9+0.35) | – |
| USDPKR ( US Dollar / Pakistani Rupee) | 3824 | – | 2676.8 | 1912.35 (1912.0+0.35) | – |
| USDPLN ( US Dollar / Polish Zloty) | 288.7 | – | 200 | 141.3 (141.3+0.0) | – |
| USDQAR ( US Dollar / Qatari Riyal) | 41.7 | – | 29.2 | 21.15 (20.8+0.35) | – |
| USDRON ( US Dollar) / Romanian Ray | 5 | – | 3.5 | 2.85 (2.5+0.35) | – |
| USDRUB ( US Dollar / Russian Ruble) | 14575.7 | – | 10202.9 | 7286.25 (7285.9+0.35) | – |
| USDRUR US Dollar / Russian Ruble | 14575.7 | – | 10202.9 | – | – |
| USD/SAR ( US Dollar / Saudi Riyal) | 1 | – | 0.6 | 0.75 (0.4+0.35) | – |
| USDSEK ( US Dollar / Swedish Krona) | 1243.2 | – | 870.3 | 619.6 (619.6+0.0) | – |
| USDSGD ( US Dollar / Singapore Dollar) | 12.6 | – | 8.9 | 6.1 (6.1+0.0) | – |
| USDSYP ( US Dollar / Syrian Pound) | 362243.9 | – | 253570.8 | 181122.35 (181122.0+0.35) | – |
| USDTHB ( US Dollar / Thai Baht) | 300 | – | 210 | 149.65 (149.3+0.35) | – |
| USDTJS US Dollar / Tajikistan Somoni | 12.1 | – | 8.5 | 6.45 (6.1+0.35) | – |
| USDTMT ( US Dollar / Turkmenistan Manat) | 10.3 | – | 7.2 | 5.45 (5.1+0.35) | – |
| USDTND ( US Dollar / Tunisian Dinar) | 444.7 | – | 311.3 | 222.75 (222.4+0.35) | – |
| USDTRY ( US Dollar / Turkish Lira) | 535.6 | – | 535.6 | 535.95 (535.6+0.35) | – |
| USDTWD US Dollar / Taiwan Dollar | 32.4 | – | 22.6 | 16.35 (16.0+0.35) | – |
| USDUAH (US Dollar / Ukrainian Hryvnia) | 616 | – | 431.2 | 308.35 (308.0+0.35) | – |
| USDUGX US Dollar / Ugandan Shilling | 177776.3 | – | 124443.4 | 88888.45 (88888.1+0.35) | – |
| USDUZS US Dollar / Uzbekistan Som | 18.7 | – | 13.1 | 9.65 (9.3+0.35) | – |
| USD/VND (US Dollar / Vietnamese Dong) | 120000 | – | 84000 | 60000.35 (60000.0+0.35) | – |
| USDVUV US Dollar / Vanuatu Vatu | 1809.8 | – | 1266.9 | 905.25 (904.9+0.35) | – |
| USDXOF US Dollar / CFA Franc (West Africa) | 70613.4 | – | 49478.2 | 35341.85 (35341.5+0.35) | – |
| USDZAR (US Dollar / South African Rand) | 287.7 | – | 125.3 | 86.0 (86.0+0.0) | – |
Exotic currency pairs are characterized by significantly wider spreads compared to cross and major currency pairs
For example, with AUDDKK, low liquidity directly impacts trading costs, sometimes reaching several hundred pips
On the other hand, some currencies, such as the Mexican peso, are offered at relatively narrow ranges, and it's worth noting that there are significant differences between currencies
When trading exotic pairs, it is essential to consider not only the spread level but also the market liquidity and volatility
Exness Precious Metals CFD Spread List
The effective average spread for Exness's precious metals CFDs is as follows:
Exness Precious Metals CFD Spread List
| Precious metal CFD | Standard account (pips) | Standard cent account (pips) | Pro account (pips) | Low spread account (pips) | Zero account (pips) |
|---|---|---|---|---|---|
| XAGAUD Silver / Australian Dollar | 8.2 | – | 5.8 | 5.35 (5.0+0.35) | 8.5 (0.0+8.5) |
| XAGEUR Silver / Euro | 4.3 | – | 3 | 2.95 (2.6+0.35) | 8.5 (0.0+8.5) |
| XAGGBP Silver / British Pound | 3.8 | – | 2.6 | 2.65 (2.3+0.35) | 8.5 (0.0+8.5) |
| XAGJPY Silver / Japanese Yen | 107.2 | – | – | – | – |
| XAGUSD Silver / US Dollar | 3.5 | 3.5 | 2.5 | 2.45 (2.1+0.35) | 7.7 (2.7+5.0) |
| XALUSD Aluminum / US Dollar | 79.8 | – | – | 230.85 (230.5+0.35) | 1669.4 (1667.0+2.4) |
| XAUAUD Gold / Australian Dollar | 454 | – | 317.8 | 164.08 (163.73+0.35) | 1432.25 (1430.7+1.55) |
| XAUEUR Gold / Euro | 329.2 | – | 230.4 | 163.58 (163.23+0.35) | 1454.55 (1453.0+1.55) |
| XAUGBP Gold / British Pound | 328 | – | 229.6 | 4.05 (3.7+0.35) | 0.55 (0.0+0.55) |
| XAUUSD Gold / US Dollar | 16 | 16 | 11.2 | 9.07 (8.87+0.20) | 88.9 (88.7+0.2) |
| XCUUSD Copper / US Dollar | 116.2 | – | – | 27.20 (27.0+0.20) | 218.93 (218.7+0.23) |
| XNIUSD Nickel / US Dollar | 916.9 | – | – | 467.83 (467.83 + 0.0) *Fees not specified | 2591.7 (2591.7+0.0) |
| XPBUSD Lead / US Dollar | 77.9 | – | – | 9.97 (9.77+0.20) | 97.5 (97.3+0.2) |
| XPDUSD Palladium / US Dollar | 192.3 | – | 134.6 | 117.53 (117.53 + 0.0) *Fee not specified | 35.3 (35.3+0.0) |
| XPTUSD Platinum / US Dollar | 81.3 | – | 57.5 | 47.07 (47.07 + 0.0) *Fee not specified | 132.3 (132.3+0.0) |
| XZNUSD Zinc / US Dollar | 44.2 | – | 75 | 0.20 (0+0.20) | 0.2 (0.0+0.2) |
In addition to gold, silver and platinum are also tradable among precious metals, but a key characteristic is the wide spread depending on the specific metal
Currencies like XAGJPY can sometimes exceed 100 pips, making short-term trading quite burdensome
If you want to trade with stable spreads, it's a good idea to choose highly liquid instruments such as XAGUSD and XAGEUR, which tend to have relatively narrow spreads
Exness Energy CFD Spread List
The effective average spread for Exness energy CFDs is as follows:
Exness Energy CFD Spread List
| Energy CFD | Standard account (pips) | Standard cent account (pips) | Pro account (pips) | Low spread account (pips) | Zero account (pips) |
|---|---|---|---|---|---|
| UKOIL Brent Crude Oil | 9.5 | – | 6.6 | 0.78 (0.43+0.35) | 0.63 (0.0+0.63) |
| USOIL WTI Crude Oil | 1.8 | – | 1.23 | 5.65 (5.30+0.35) | 3.25 (0.0+3.25) |
| XNGUSD Natural Gas / US Dollar | 39.2 | – | 27.47 | 22.68 (22.33+0.35) | 19.5 (16.0+3.5) |
In energy CFDs, WTI crude oil, Brent crude oil, and natural gas are the main instruments
Crude oil has a high trading volume, and WTI is relatively stable, fluctuating around 1-2 pips
On the other hand, natural gas spreads can exceed 20 pips, resulting in a larger fluctuation range
Energy-related stocks are particularly susceptible to fluctuations due to supply and demand and seasonal factors, so trading primarily in crude oil is advantageous if you want to keep costs down
Exness Stock Index CFD Spread List
The effective average spread for Exness stock index CFDs is as follows:
Exness Stock Index CFD Spread List
| Stock index CFDs | Standard account (pips) | Standard cent account (pips) | Pro account (pips) | Low spread account (pips) | Zero account (pips) |
|---|---|---|---|---|---|
| AUS200 (Australia ASX200) | 18.8 | – | 73.6 | 23.45 (23.4+0.05) | 18.865 (18.8+0.065) |
| DE30 German DAX30 | 0.9 | – | 8.5 | 1.50 (1.3+0.20) | 1.125 (0.9+0.225) |
| DXY US Dollar Index | 0.3 | – | 0.3 | 1.50 (1.2+0.30) | 1.075 (0.3+0.775) |
| FR40 France CAC40 | 4.4 | – | 35.4 | 2.60 (2.5+0.10) | 4.49 (4.4+0.09) |
| HK50 Hong Kong Hang Seng Index | 0 | – | 29.8 | 8.05 (8.0+0.05) | 0.14 (0.0+0.14) |
| IN50 India Nifty50 | 28.6 | – | 152.3 | 37.60 (37.6+0.0) | 28.6 (28.6+0.0) |
JP225 Nikkei | 0 | – | 16 | 0.00 (0.0+0.0) | 0.0 (0.0+0.0) |
| STOXX50 Euro STOXX50 | 1.1 | – | 51 | 5.45 (5.3+0.15) | 1.275 (1.1+0.175) |
| UK100 (UK FTSE100) | 17.1 | – | 67.8 | 20.80 (20.7+0.10) | 17.225 (17.1+0.125) |
| US30_x10 Dow Jones Industrial Average (US30, x10) | 0 | – | 2.7 | 0.20 (0.1+0.10) | 0.2 (0.0+0.2) |
| US30 Dow Jones Industrial Average (US30) | 0 | – | 2.7 | 0.20 (0.1+0.10) | 0.2 (0.0+0.2) |
| US500_x100 S&P500 (x100) | 0 | – | 5.8 | 0.03 (0.0+0.025) | 0.05 (0.0+0.05) |
| US500 S&P500 | 0 | – | 5.8 | 0.03 (0.0+0.025) | 0.05 (0.0+0.05) |
| USTEC_x100 Nasdaq 100 (x100) | 0 | – | 19.9 | 1.3625 (1.3+0.0625) | 0.125 (0.0+0.125) |
| USTEC Nasdaq 100 | 0 | – | 19.9 | 1.3625 (1.3+0.0625) | 0.125 (0.0+0.125) |
Stock market indices have unique characteristics in each country, and spreads also vary accordingly
The US indices DXY and JP225 are stable, trading in indices of only a few pips, but the Australian indices AUS200 and the French indices FR40 can reach double digits
Highly liquid US and Japanese indices are suitable for short-term trading, while European indices are better suited for medium- to long-term trading, taking into account the costs associated with spreads
Exness Cryptocurrency CFD Spread List
The effective average spread for Exness's cryptocurrency CFDs is as follows:
Exness Cryptocurrency CFD Spread List
| Cryptocurrency CFDs | Standard Account (Points) | Standard Cent Account (Points) | Pro account (points) | Low Spread Account (Points) | Zero Account (Points) |
|---|---|---|---|---|---|
| INCH USD ( 1 inch / US dollar) | 216 | – | 136 | 0.0 (0.0+0.0) | 0.0 (0.0+0.0) |
| AAVEUSD (Aave / US Dollar) | 797 | – | 558 | 0.0 (0.0+0.0) | 0.0 (0.0+0.0) |
| ADAUSD ( Cardano / US Dollar) | 277 | – | 173 | 0.0 (0.0+0.0) | 0.0 (0.0+0.0) |
| BATUSD Basic Attention Token / US Dollar | 2271 | – | 1591 | 237.0 (237.0+0.0) | 0.0 (0.0+0.0) |
| BCHUSD Bitcoin Cash / US Dollar | 196.3 | – | 133.7 | 27.7 (27.7+0.0) | 16.7 (16.7+0.0) |
| BNBUSD (Binance Coin / US Dollar) | 2920 | – | 1825 | 1171.0 (1171.0+0.0) | 990.0 (990.0+0.0) |
| BTCAUD Bitcoin / Australian Dollar | 756.7 | – | 529.3 | 316.35 (316.0+0.35) | 186.77 (186.0+0.77) |
| BTCCNH Bitcoin / Offshore Chinese Yuan | 7765.3 | – | 5345.7 | 3695.35 (3695.0+0.35) | 2366.27 (2365.0+1.27) |
| BTCJPY Bitcoin / Japanese Yen | 5610.3 | – | 3927 | 2062.05 (2061.7+0.35) | 1615.8 (1615.3+0.5) |
| BTCKRW Bitcoin / South Korean Won | 362175 | – | 226360 | 175770.0 (175770.0+0.0) | 165135.0 (165135.0+0.0) |
| BTCTHB Bitcoin / Thai Baht | 44918.3 | – | 31427.3 | 22811.35 (22811.0+0.35) | 20095.2 (20090.7+4.52) |
| BTCUSD Bitcoin / US Dollar | 2160 | 2160 | 1512 | 980.20 (980.0+0.20) | 0.8 (0.0+0.8) |
| BTCXAG Bitcoin / Silver | 4337.3 | – | 3034.3 | 2452.05 (2451.7+0.35) | 537.3 (533.3+4.0) |
| BTCXAU Bitcoin / Gold | 1054 | – | 738 | 392.65 (392.3+0.35) | 218.0 (217.3+0.7) |
| BTCZAR Bitcoin / South African Rand | 4722 | – | 2183.7 | 2039.65 (2039.3+0.35) | 534.4 (531.3+3.1) |
| CAKEUSD Pancake Swap / US Dollar | 150 | – | 94 | 0.0 (0.0+0.0) | 0.0 (0.0+0.0) |
| COPUSD Colombian Peso / US Dollar | 736 | – | 460 | 0.0 (0.0+0.0) | 0.0 (0.0+0.0) |
| DOGEUSD ( Dogecoin / US Dollar) | 591 | – | 369 | 0.0 (0.0+0.0) | 0.0 (0.0+0.0) |
| DOTUSD ( Polka Dot / US Dollar) | 266 | – | 166 | 0.0 (0.0+0.0) | 0.0 (0.0+0.0) |
| ENJUSD Engine Coin / US Dollar | 234 | – | 146 | 0.0 (0.0+0.0) | 0.0 (0.0+0.0) |
| ETHUSD Ethereum / US Dollar | 180 | – | 126 | 15.05 (15.0+0.05) | 0.15 (0.0+0.15) |
| FILUSD ( Filecoin / US Dollar) | 277 | – | 173 | 0.0 (0.0+0.0) | 0.0 (0.0+0.0) |
| HBARUSD ( Hedera / US Dollar) | 305 | – | 191 | 0.0 (0.0+0.0) | 0.0 (0.0+0.0) |
| HTUSD Huobi Token / US Dollar | 284 | – | 177 | 552.0 (552.0+0.0) | 0.0 (0.0+0.0) |
| IOSTUSD ( Isot/US Dollar) | 1823 | – | 1140 | 0.0 (0.0+0.0) | 0.0 (0.0+0.0) |
| LINKUSD Chainlink / US Dollar | 95 | – | 66 | 0.0 (0.0+0.0) | 0.0 (0.0+0.0) |
| LTCUSD (Litecoin / US Dollar) | 123.7 | – | 90.3 | 25.73 (25.7+0.03) | 37.32 (37.3+0.02) |
| MANAUSD ( Decentral Rand / US Dollar) | 4038 | – | 2524 | 0.0 (0.0+0.0) | 0.0 (0.0+0.0) |
| MATICUSD Polygon (MATIC) / US Dollar | 2006 | – | 1254 | 0.0 (0.0+0.0) | 0.0 (0.0+0.0) |
| MBTUSD MBT / US Dollar | 2000 | – | 1400 | 1000.0 (1000.0+0.0) | 1000.0 (1000.0+0.0) |
| SNXUSD Synthetics / US Dollar | 695 | – | 487 | 0.0 (0.0+0.0) | 0.0 (0.0+0.0) |
| SOLUSD ( Solana / US Dollar) | 5419 | – | 3387 | 1110.0 (1110.0+0.0) | 710.0 (710.0+0.0) |
| THETAUSD (Theta/US Dollar) | 791 | – | 495 | 0.0 (0.0+0.0) | 0.0 (0.0+0.0) |
| UNIUSD (Uniswap / US Dollar) | 91 | – | 64 | 0.0 (0.0+0.0) | 0.0 (0.0+0.0) |
| XRPUSD (Ripple / US Dollar) | 940 | – | 663.3 | 0.0 (0.0+0.0) | 0.0 (0.0+0.0) |
| XTZUSD Tezos / US Dollar | 446 | – | 278 | 0.0 (0.0+0.0) | 0.0 (0.0+0.0) |
Cryptocurrencies have wide spreads depending on the specific cryptocurrency; Bitcoin and Ethereum have relatively narrow spreads and are easy to trade, while altcoins can have wide spreads of several hundred to several thousand points
Altcoins, especially those with low liquidity, can have large spreads even under normal circumstances, so it's more practical to reduce trading frequency and use them from a medium- to long-term perspective
Exness Stock CFD Spread List
The effective average spread for Exness stock CFDs is as follows:
Exness Stock CFD Spread List
| Stock CFDs | Standard Account (Points) | Pro account (points) | Low Spread Account (Points) | Zero Account (Points) |
|---|---|---|---|---|
| AAPL Apple | 13 | 14 | 7 | 5.105 (5+0.105) |
| ABBV AbbVie | 18 | 14 | 10 | 8.113 (8+0.113) |
| ABT Abbott Laboratories | 12 | 8 | 7 | 5.103 (5+0.103) |
| ADBE (Adobe) | 28 | 20 | 18 | 8.490 (8+0.490) |
| ADP Automatic Data Processing | 24 | 18 | 14 | 10.219 (10+0.219) |
| AMC Entertainment | 5 | 3 | 3 | 0.0 (0+0.0) |
| AMD Advanced Micro Devices | 48 | 67 | 25 | 15.540 (15+0.540) |
| AMGN (Amgen) | 24 | 17 | 15 | 1.675 (1+0.675) |
| AMT American Tower | 17 | 13 | 11 | 5.291 (5+0.291) |
| AMAZN Amazon | 16 | 22 | 8 | 4.180 (4+0.180) |
| ATVI ( Activision Blizzard) | 9 | 5 | 5 | 3.360 (3+0.360) |
| AVGO Broadcom | 21 | 15 | 11 | 10.040 (10+0.040) |
| BA Boeing | 192 | 283 | 83 | 8.438 (7+1.438) |
| BABA Alibaba | 33 | 45 | 19 | 0.660 (0+0.660) |
| BAC (Bank of America) | 17 | 10 | 7 | 52.360 (52+0.360) |
| BB Blackberry | 13 | 15 | 7 | 0.0 (0+0.0) |
| BBBY Bed Bath & Beyond | 0 | 0 | 1 | 4.250 (4+0.250) |
| BEKE KE Holdings | 16 | 21 | 9 | 22.688 (22+0.688) |
| BIDU | 73 | 116 | 35 | 0.800 (0+0.800) |
| BIIB Biogen | 15 | 10 | 10 | 3.562 (3+0.562) |
| BILI | 18 | 25 | 10 | 2.106 (2+0.106) |
| BMY Bristol-Myers Squibb | 8 | 5 | 5 | 0.0 (0+0.0) |
| BRQS Volks Technology | 1 | 1 | 1 | 0.0 (0+0.0) |
| BYND Beyond Meat | 5 | 3 | 3 | 1.550 (1+0.550) |
| C Citigroup | 53 | 67 | 28 | 3.0 (3+0.0) |
| CAN | 5 | 3 | 3 | 2.672 (2+0.672) |
| CHTR Charter Communications | 24 | 17 | 17 | 2.094 (2+0.094) |
| CMCSA Comcast | 6 | 4 | 4 | 25.360 (25+0.360) |
| CME CME Group | 24 | 16 | 14 | 0.322 (0+0.322) |
| COST | 60 | 42 | 32 | 2.360 (2+0.360) |
| CSCO Cisco Systems | 10 | 7 | 6 | 3.041 (3+0.041) |
| CSX Corporation | 6 | 4 | 4 | 21.106 (21+0.106) |
| CVS CVS Health | 8 | 5 | 5 | 6.163 (6+0.163) |
| EA Electronic Arts | 15 | 11 | 9 | 0.360 (0+0.360) |
| eBay | 10 | 7 | 6 | 68.188 (68+0.188) |
| EDU New Oriental | 141 | 99 | 71 | 43.972 (43+0.972) |
| EQIX | 111 | 78 | 63 | 30.375 (30+0.375) |
| Fford | 18 | 13 | 11 | 9.420 (9+0.420) |
| FB (now Meta) | 75 | 67 | 39 | 84.238 (84+0.238) |
| FTNT Fortinet | 31 | 49 | 14 | 3.525 (3+0.525) |
| FUTU Holdings | 203 | 322 | 97 | 5.103 (5+0.103) |
| GILD Gilead Sciences | 13 | 9 | 7 | 6.270 (6+0.270) |
| Google Alphabet | 20 | 14 | 11 | 8.234 (8+0.234) |
| HD Home Depot | 22 | 16 | 12 | 9.125 (9+0.125) |
| IBM IBM | 20 | 14 | 11 | 0.360 (0+0.360) |
| Intel | 11 | 9 | 7 | 6.450 (6+0.450) |
| INTU (Intuit) | 58 | 40 | 34 | 0.0 (0+0.0) |
| IQ (IQ) | 2 | 1 | 1 | 26.677 (26+0.677) |
| ISRG Intuitive Surgical | 62 | 44 | 38 | 1.188 (1+0.188) |
| JD JD.com | 8 | 9 | 5 | 0.540 (0+0.540) |
| JNJ Johnson & Johnson | 14 | 9 | 9 | 10.360 (10+0.360) |
| JPM (JP Morgan Chase) | 32 | 22 | 18 | 0.360 (0+0.360) |
| KO Coca-Cola | 10 | 7 | 6 | 16.125 (16+0.125) |
| LI Re-Auto | 21 | 31 | 9 | 7.325 (7+0.325) |
| LIN Linde | 40 | 28 | 22 | 28.197 (28+0.197) |
| LLY ( Eli Lilly) | 60 | 42 | 32 | 11.444 (11+0.444) |
| LMT Lockheed Martin | 33 | 23 | 19 | 12.900 (12+0.900) |
| Mastercard | 54 | 38 | 30 | 2.600 (2+0.600) |
| MCD McDonald's | 24 | 17 | 14 | 3.100 (3+0.100) |
| MDLZ Mondelez International | 9 | 6 | 5 | 30.420 (30+0.420) |
| META Meta-Platforms | 75 | 67 | 39 | 3.275 (3+0.275) |
| MMM 3M | 15 | 10 | 8 | 3.088 (3+0.088) |
| MO Artoria | 9 | 7 | 5 | 3.097 (3+0.097) |
| MRK Merck | 9 | 7 | 5 | 21.360 (21+0.360) |
| MS Morgan Stanley | 14 | 10 | 8 | 1.360 (1+0.360) |
| Microsoft | 53 | 67 | 28 | 84.720 (84+0.720) |
| NFLX Netflix | 192 | 135 | 99 | 1.250 (1+0.250) |
| NIO | 8 | 11 | 5 | 0.480 (0+0.480) |
| NKE Nike | 13 | 9 | 8 | 0.480 (0+0.480) |
| NTES (NetEase) | 95 | 168 | 48 | 41.388 (41+0.388) |
| NVDA | 32 | 44 | 16 | 11.015 (11+0.015) |
| ORCL Oracle | 41 | 67 | 22 | 15.360 (15+0.360) |
| PDD Pinduoduo | 48 | 82 | 28 | 17.500 (17+0.500) |
| PEP PepsiCo | 11 | 8 | 7 | 3.141 (3+0.141) |
| PFE Pfizer | 10 | 7 | 7 | 0.360 (0+0.360) |
| PG P&G | 11 | 7 | 7 | 3.125 (3+0.125) |
| PM Philip Morris | 18 | 12 | 10 | 8.119 (8+0.119) |
| PYPL ( PayPal) | 31 | 45 | 17 | 8.540 (8+0.540) |
| REGN Regeneron | 62 | 44 | 36 | 22.672 (22+0.672) |
| RLX RLX Technology | 7 | 5 | 5 | 1.0 (1+0.0) |
| SBUX Starbucks | 8 | 6 | 5 | 2.110 (2+0.110) |
| T AT&T | 10 | 7 | 7 | 9.138 (9+0.138) |
| TAL TAL Education | 33 | 23 | 18 | 0.0 (0+0.0) |
| TIGR UP Fintech (Tiger Securities) | 3 | 3 | 1 | 1.0 (1+0.0) |
| TME (Tencent Music) | 7 | 5 | 5 | 14.188 (14+0.188) |
| TMO Thermo Fisher | 44 | 31 | 26 | 7.628 (7+0.628) |
| TMUS ( T-Mobile US) | 17 | 13 | 9 | 1.540 (1+0.540) |
| TSLA Tesla | 15 | 15 | 8 | 11.327 (11+0.327) |
| TSM Taiwan Semiconductor Manufacturing (TSMC) | 32 | 47 | 15 | 0.163 (0+0.163) |
| UNH UnitedHealth | 20 | 14 | 14 | 1.100 (0+1.100) |
| UPS UPS | 7 | 5 | 5 | 1.197 (1+0.197) |
| V visa | 24 | 17 | 13 | 1.113 (1+0.113) |
| VIPS VIP Shop Holdings | 5 | 3 | 3 | 3.540 (3+0.540) |
| VRTX Vertex Pharmaceuticals | 39 | 27 | 23 | 3.105 (3+0.105) |
| VZ Verizon | 10 | 7 | 7 | 0.360 (0+0.360) |
| WFC Wells Fargo | 20 | 14 | 11 | 4.360 (4+0.360) |
| WMT Walmart | 14 | 10 | 8 | 4.180 (4+0.180) |
| XOM ExxonMobil | 10 | 7 | 6 | 0.360 (0+0.360) |
| XPEV Xiao Peng (Xiaopeng Motor) | 11 | 14 | 5 | 2.750 (2+0.250) |
| YUMC (Yum China) | 8 | 6 | 4 | 1.188 (1+0.188) |
| ZTO ZTO Express | 5 | 5 | 3 | 0.188 (0+0.188) |
Stock CFDs mainly feature popular US stocks such as Apple and Amazon, but the spreads are wider compared to currency pairs
On average, the cost is typically around 10-20 points, and this tends to be a burden in short-term trading
However, because price fluctuations are large during earnings announcements and market events, it can be said that the potential for returns exceeding the costs is a major attraction
Comparing Exness's standard stock spreads with those of other companies
Here, we will compare Exness's spreads with those of other companies
- Comparison of major currency pairs (USD/JPY, EUR/USD) with other companies
- Gold (XAU/USD) comparison with other companies
- Comparison of stock indices (US30, JP225, etc.) with other companies
- Bitcoin (BTC/USD) comparison with other companies
Let's compare the average spreads for these standard stocks over the same period between Exness and other companies
For a comparison of spreads offered by various overseas forex brokers, please refer to Summary of Overseas Forex Spread Comparisons
Comparison of major currency pairs (USD/JPY, EUR/USD) with other companies
The average spreads for major currency pairs offered by Exness compared to other companies are as follows:
| Company Name Account Type | USD/JPY | EURUSD | GBPUSD | AUDUSD |
|---|---|---|---|---|
| Exless Standard Account | 1.2 | 1.1 | 1.3 | 1.1 |
| Axi Standard Account | 1.3 | 1.1 | 2.1 | 1.1 |
| ThreeTrader Pure Spread Account | 0.9 | 0.8 | 1.3 | 0.8 |
| easyMarkets MT5 account | 2.2 | 1 | 2 | 2.2 |
| TitanFX Standard Account | 1.8 | 1.6 | 2 | 1.4 |
| HFM Premium Account | 2.8 | 2.2 | 2.7 | 2.2 |
| Vantage Trading Standard Account | 3 | 2.6 | 3.1 | 2.9 |
| FXGT Standard+ Account | 2.4 | 2 | 2.4 | 2.9 |
| Axiory Standard Account | 1.5 | 1.3 | 1.8 | 1.7 |
Exness's standard account offers stable trading levels of 1.1 to 1.2 pips for USD/JPY and EUR/USD
Compared to other companies, our average size is smaller, giving us a more favorable position than Axi and easyMarkets
On the other hand, some brokers, like ThreeTrader, offer equally or even narrower rates, so in terms of costs, it could be said that it is "among the most stable but not the narrowest."
| Company Name Account Type | USD/JPY | EURUSD | GBPUSD | AUDUSD |
|---|---|---|---|---|
| Exness Zero Go | 0.45 (0.1+0.35) | 0.45 (0.1+0.35) | 0.65 (0.2+0.45) | 0.6(0.1+0.5) |
| Axi Elite Account | 0.675 (0.5+0.175) | 0.575 (0.4+0.175) | 0.875 (0.7+0.175) | 0.475(0.3+0.175) |
| ThreeTrader Raw Zero Account | 0.7 (0.5+0.2) | 0.6 (0.4+0.2) | 1.0 (0.8+0.2) | 0.5 (0.3+0.2) |
| FXGT ECN account | 1.0 (0.7+0.3) | 0.9 (0.6+0.3) | 1.2 (0.9+0.3) | 1.2 (0.9+0.3) |
| HFM Zero Spread Account | 1.1 (0.8+0.3) | 0.7 (0.4+0.3) | 0.9 (0.6+0.3) | 0.6 (0.3+0.3) |
| TitanFX Blade Account | 1.15 (0.8+0.35) | 0.95 (0.6+0.35) | 1.35 (1.0+0.35) | 0.75 (0.4+0.35) |
| Vantage Trading ECN Account | 1.3 (1.0+0.3) | 0.8 (0.5+0.3) | 1.1 (0.8+0.3) | 1.0 (0.7+0.3) |
| Axiory Nano Spread Account | 0.7 (0.4+0.3) | 0.6 (0.3+0.3) | 0.6 (0.3+0.3) | 0.7 (0.4+0.3) |
Exness's Zero Account has very low effective costs, with profit margins of around 0.45 to 0.65 pips for the four major currency pairs
In particular, for USDJPY and EURUSD, the trading window is narrower than that of Axi and FXGT, making it a favorable option for short-term trading
While it's roughly on par with some brokers, such as ThreeTrader's Raw account, when you consider the overall trading environment, including leverage, the Zero account has an advantage in terms of cost performance for major currencies
Gold (XAU/USD) comparison with other companies
The average spread for Exness Gold compared to other companies is as follows:
| Company Name Account Type | XAUUSD |
|---|---|
| Exless Standard Account | 1.6 |
| Axi Standard Account | 1.8 |
| ThreeTrader Pure Spread Account | 1.5 |
| easyMarkets MT5 account | 4.3 |
| TitanFX Standard Account | 2.7 |
| HFM Premium Account | 3.2 |
| Vantage Trading Standard Account | 3.4 |
| FXGT Standard+ Account | 4 |
| Axiory Standard Account | 3.3 |
The average spread for XAUUSD on Exness's standard account is 1.6 pips, which is comparable to ThreeTrader's 1.5 pips
It is clearly more advantageous than Axi (1.8 pips) and easyMarkets (4.3 pips), and is quite competitive even when trading gold in a standard account
While it may be slightly inferior to ThreeTrader in short-term trading situations, overall it can be said to offer stable conditions
| Company Name Account Type | XAUUSD |
|---|---|
| Exness Zero Go | 0.8 (0+0.8) |
| Axi Elite Account | 1.35 (1.0+0.125) |
| ThreeTrader Raw Zero Account | 1.0 (1.0+0) |
| FXGT ECN account | 2.85 (2.6+0.25) |
| HFM Zero Spread Account | 2.4 (1.7+0.7) |
| TitanFX Blade Account | 2.63 (2.6+0.03) |
| Vantage Trading ECN Account | 1.0 (0.7+0.3) |
| Axiory Nano Spread Account | 1.9 (1.5+0.3) |
Exness's Zero account offers an extremely low effective spread of 0.8 pips for XAUUSD, which is more favorable than ThreeTrader (1.0 pips) and Axi (1.35 pips).
In particular, this difference can increase profitability in scalping and short-term trading
Compared to FXGT's ECN account (2.85 pips) and easyMarkets (2.85 pips or more), the trading margin is significantly narrower, making gold trading with a Zero account a major cost advantage
For those interested in gold trading in overseas forex, which offers high volatility and is easy to profit from, we've thoroughly covered recommended brokers in our Complete Guide to Gold Trading in Overseas Forex
Comparison of stock indices (US30, JP225, etc.) with other companies
The average spread of Exness's stock index compared to other companies is as follows:
| Company Name Account Type | JP225 Nikkei Stock Average (pips) | US 30 Dow Jones Industrial Average (pips) |
|---|---|---|
| Exless Standard Account | 4.2 | 1.7 |
| Axi Standard Account | 8.1 | 2.3 |
| ThreeTrader Pure Spread Account | 16.3 | 2.9 |
| easyMarkets MT5 account | 7.4 | 4.8 |
| TitanFX Standard Account | 9.3 | 4.1 |
| HFM Premium Account | 12.1 | 3.9 |
| Vantage Trading Standard Account | 6 | 2.7 |
| FXGT Standard+ Account | 8.8 | 3.8 |
| Axiory Standard Account | 10 | 2.9 |
In Exness's standard account, the trading ranges are relatively narrow, with JP225 at 4.2 pips and US30 at 1.7 pips
Compared to Axi (8.1 pips / 2.3 pips) and easyMarkets (7.4 pips / 4.8 pips), you can see that the spread is considerably narrower
Furthermore, ThreeTrader's Pure Spread account is somewhat inferior with a spread of 2.9 pips for US30, and significantly lower with JP225, at over 16 pips
| Company Name Account Type | JP225 Nikkei Stock Average (pips) | US 30 Dow Jones Industrial Average (pips) |
|---|---|---|
| Exness Zero Go | 0.05(0.0+0.05) | 0.45(0.0+0.45) |
| Axi Elite Account | 8.225 (8.1+0.125) | 2.425 (2.3+0.125) |
| ThreeTrader Raw Zero Account | 16.4(16.2+0.2) | 4.0 (3.8+0.2) |
| FXGT ECN account | 6.1(5.9+0.2) | 1.15 (1.0+0.15) |
| HFM Zero Spread Account | 12 | 3.9 |
| TitanFX Blade Account | 8.13 (8.1+0.03) | 2.96 (2.9+0.06) |
| Vantage Trading ECN Account | 5.8 | 2.7 |
| Axiory Nano Spread Account | 11 | 3.9 |
Exness's Zero Account offers extremely low costs, with JP225 trading at an effective rate of 0.05 pips and US30 trading at 0.45 pips
offers a significant advantage compared to Axi's Elite account (8.225 pips / 2.425 pips) and FXGT's ECN account (6.1 pips / 1.15 pips) , and is particularly strong for short-term trading and scalping.
ThreeTrader's Raw Zero account, highly regarded for its low spreads, stands out in comparison to JP225's spread of over 16 pips and US30's spread of 4 pips, highlighting Exness's superior cost competitiveness
Bitcoin (BTC/USD) comparison with other companies
The average spread for Bitcoin at Exness compared to other companies is as follows:
| Company Name Account Type | Broker Name Account Type BTCUSD Bitcoin (pips) |
|---|---|
| Exless Standard Account | 21.6 |
| Axi Standard Account | 24.2 |
| ThreeTrader Pure Spread Account | 20.7 |
| easyMarkets MT5 account | 57.5 |
| TitanFX Standard Account | 60.4 |
| Vantage Trading Standard Account | 26 |
| FXGT Standard+ Account | 53 |
The average spread for BTCUSD on Exness's Standard account is 21.6 pips, which is slightly more favorable than Axi (24.2 pips)
While slightly inferior to ThreeTrader's Pure Spread account (20.7 pips), significantly lower in cost compared to easyMarkets (57.5 pips) and FXGT's ECN account .
While cryptocurrencies generally tend to have wide spreads, Exness maintains relatively stable and low spreads, making it a favorable option for short-term trading
However, Eness's Bitcoin leverage will be reduced to a maximum of 400x, making it less advantageous in terms of leverage
| Company Name Account Type | BTCUSD Bitcoin (pips) |
|---|---|
| Exness Zero Go | 0.(0.0+0.35) |
| Axi Elite Account | 24.375 (24.2+0.175) |
| ThreeTrader Raw Zero Account | 20.9 (20.7+0.2) |
| FXGT ECN account | 22.0+0.1% (22.0+0.1%) |
| TitanFX Blade Account | 60.4 |
| Vantage Trading ECN Account | 26 |
Exness's Zero Account boasts an extremely narrow spread of just 0.35 pips for BTCUSD, setting it apart from other companies
Axi's Elite account has a cost of 24.375 pips, ThreeTrader's Raw Zero account has 20.9 pips, and FXGT's ECN account has 22 pips + 0.1%, all showing significant cost differences
If you want to trade Bitcoin with low spreads, Exness's Zero Account is especially recommended among the many overseas forex accounts available
Points to note and summary regarding Exness spreads
Here, we will explain three important points regarding Exness spreads
- It can spread depending on the time of day
- Even if we have an advantage over other companies, we're not always the narrowest
- Check on MT4/MT5 before actually trading
Let's take a closer look at the trends during times when spreads tend to widen, and the points to keep in mind for trading with favorable spreads that make it easier to win, not just with Exness
It can spread depending on the time of day
Exness generally offers narrow spreads, but they tend to widen temporarily during periods of low liquidity in the early morning and when economic indicators are released, as described below .
- Early morning and immediately after the start of the week: These are times when spreads tend to widen
- Before and after the release of economic indicators: A time when the market is likely to expand rapidly in an instant after the announcement
- Breaking News: The sudden announcement of highly attention-grabbing news causes a momentary surge in popularity
This is a characteristic of spreads similar to those of other overseas forex brokers, and it is a significant risk factor, especially for traders who engage in short-term trading such as scalping and day trading
Exness imposes leverage restrictions on economic indicators and during weekends and the start of the week, so it's best to avoid short-term trading during those times
Even if we have an advantage over other companies, we're not always the narrowest
Exness has a strong presence in major currency pairs, but it's not the cheapest for all instruments
For minor currencies and cryptocurrencies, other companies may have narrower trading networks
| Brand | Features of Exdefinition | Situations where competitors are likely to have an advantage |
|---|---|---|
| Major currencies | on average narrow | Strengths |
| Minor currencies | It can spread | Other companies may have limited space |
| CFD instruments | Large fluctuations | Other companies may be more stable |
For those prioritizing spreads, it's crucial to compare different platforms for each instrument you trade and choose the most cost-effective environment
Check on MT4/MT5 before actually trading
The spread fluctuates depending on market conditions
Therefore, to avoid trading at unfavorable rates due to the widening spread, it is important to "check the real-time spread."
The real-time spread is automatically displayed in the list of bid and ask prices on the smartphone app, so you can check it from the list of bid and ask prices
On the PC versions of MT4 and MT5, check the spread using the following steps
Exness Real-Time Spread Check Procedure
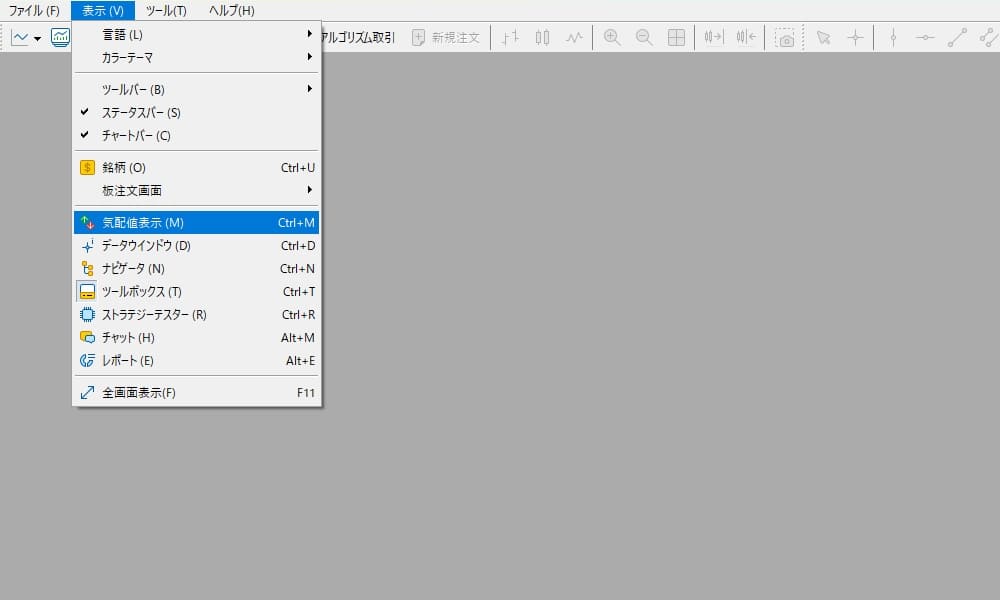
Open "Market Watch" from the "View" menu at the top of MT4 or MT5

Once the list of quotes is displayed, right-click on the list and add "Spread" from "Display Columns"
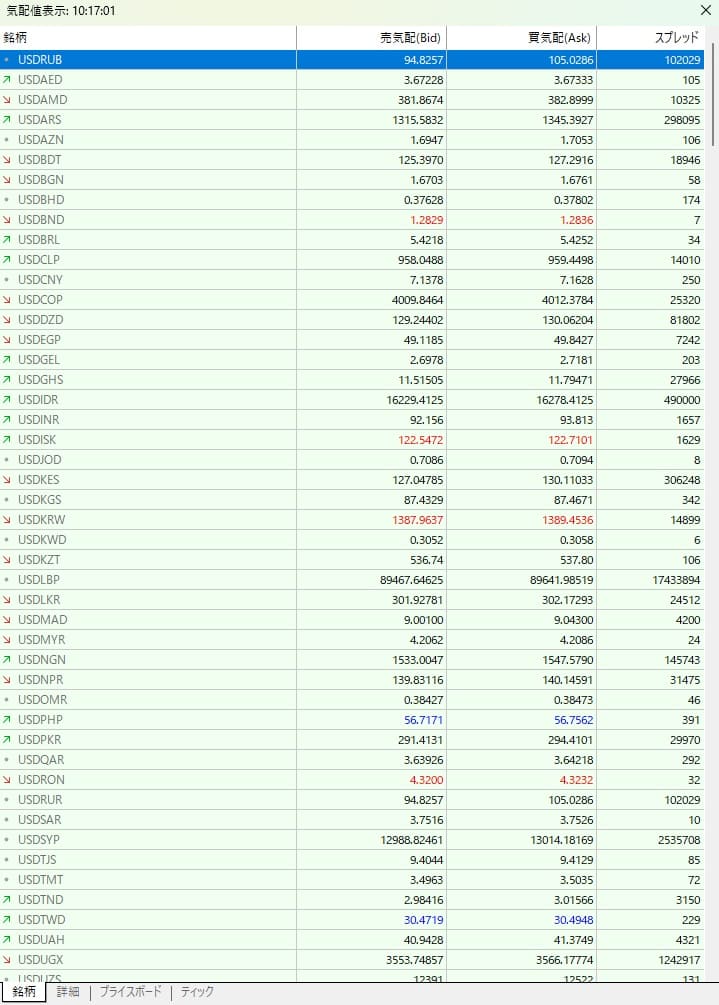
A spread column has been added to the right of the quote list, allowing you to view real-time spreads
Frequently Asked Questions about Exness Spreads
What is a spread?
The spread refers to the difference between the "bid price" and the "ask price" of a trading instrument, and is generally expressed in points. For example, if the bid is 1.11113 and the ask price is 1.11125, the spread is 0.00012 = 1.2
How do the spread structures differ for each account type?
- rn t
- Standard Account, Pro Account, and Low Spread Account: Variable spreads are used. They fluctuate depending on liquidity and market conditions
- Zero Account: Generally a fixed-rate system, offering "0 spread for over 95% of the day" for the top 30 stocks
rn t
rn
However, there may be fluctuations during certain time periods, such as during rollovers or when economic indicators are released
Which Exness account specifically offers the narrowest spreads?
The account with the narrowest spread is the Zero Account. Most instruments (especially major currency pairs) can be traded with zero spread, but trading fees apply. Depending on the situation, a Low Spread Account may end up being cheaper overall for minor currencies, cryptocurrencies, and commodities, so it is recommended to use different accounts depending on the instrument
Are there any differences between the spread table published by Exness and the actual trading environment?
Yes. The figures on the official website are "average values" and may differ from real-time figures. It is best to check the actual spread on MT4/MT5
Does the spread vary depending on the account balance and trading volume?
No. Spreads generally fluctuate depending on market liquidity and time of day, and are not directly affected by balance or lot size. However, slippage may occur with large orders
Is it true that Zero Account offers "over 95% zero spreads"?
Yes. As officially announced, the top 30 stocks offer a 0 spread for over 95% of the time. However, the spread may widen during the remaining time or in periods of low liquidity
How widespread will it be when the indicators are released?
During major events such as US employment statistics releases and FOMC meetings, the price can temporarily expand by several tens of pips. This is a common trend across all brokers, not just Exness
To reduce Exness costs, try "MoneyChat's Cashback."
In addition to low-spread account types, Exness also allows you to reduce costs through money chat cashback
For example, by linking a Standard account, which offers a cashback equivalent to 40% of the spread, with MoneyChat, you can trade at the following effective spread .
| currency pair | Standard account (pips) | Effective spread when MoneyChat's 40% cashback is applied |
|---|---|---|
| EUR/USD ( Euro / US Dollar) | 0.9 | 0.54 |
| GBP/USD (British Pound/US Dollar) | 1 | 0.6 |
| USD/JPY (US Dollar / Japanese Yen) | 1 | 0.6 |
| USDCHF ( US Dollar / Swiss Franc) | 1.3 | 0.78 |
| USDCAD (US Dollar / Canadian Dollar) | 1.5 | 0.9 |
| AUD/USD (Australian Dollar / US Dollar) | 0.9 | 0.54 |
| NZDUSD ( New Zealand Dollar / US Dollar) | 1.8 | 1.08 |
The effective spread is almost halved, and you can earn profits through cashback regardless of whether you win or lose a trade
If you want to keep Exness costs down while reliably receiving cashback, please check out Exness Cashback